About StatPecker
Imagine staring at a spreadsheet, a sea of numbers that holds a powerful story, but lacking the time or design skills to set it free. This is the journey StatPecker begins with. It is an AI-powered companion built for the modern storyteller, transforming raw, often intimidating data into visually captivating infographics in mere seconds. Born from the founders' own experiences in tech and product development, StatPecker is designed to democratize data visualization, making it accessible to anyone with a story to tell. It serves a diverse cast of characters: the content creator racing a deadline, the marketer crafting a compelling report, the educator simplifying complex topics, and the analyst seeking to communicate trends with clarity. Its core mission is to automate the tedious process of data storytelling, eliminating the need for manual design work or expensive services. By doing so, StatPecker empowers its users to focus on what truly matters—extracting the narrative, uncovering the insights, and amplifying their message with credibility and visual impact. It's more than a tool; it's a bridge between raw information and human understanding.
Features of StatPecker
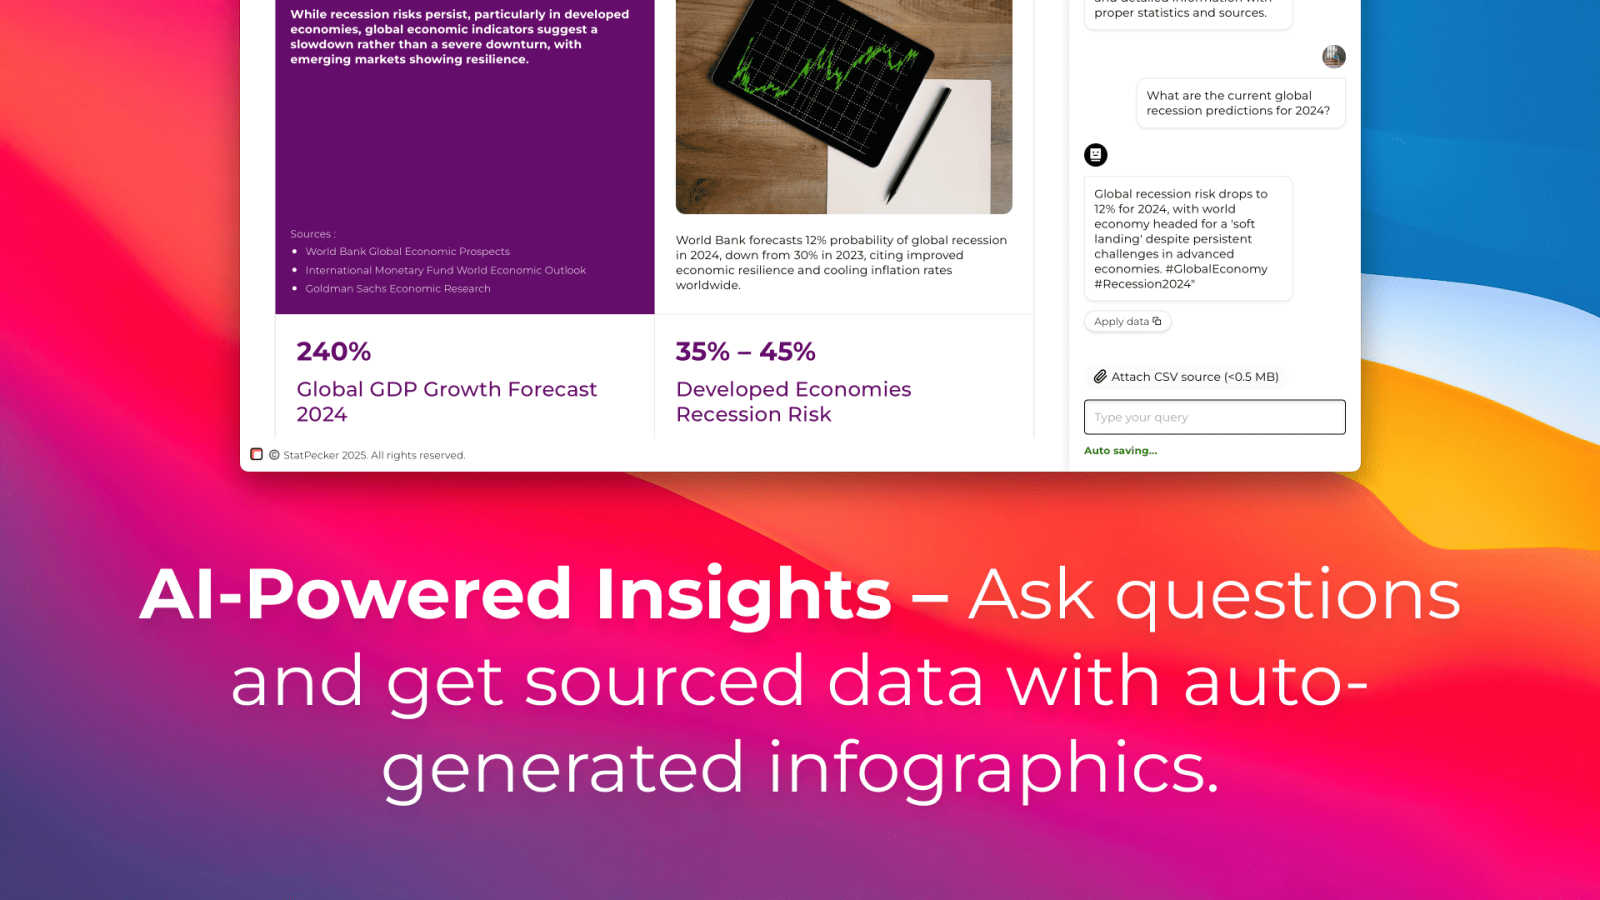
Ask Your Query
Begin your data journey with a simple question. StatPecker's AI acts as your personal research assistant, pulling insights from validated sources to generate answers. There's no need to navigate complex analytics software; just ask in plain language and receive credible, data-backed responses almost instantly, ready to be visualized.
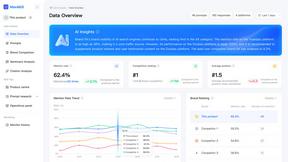
Upload & Analyze CSVs (Local SQL Agent)
For your private data, StatPecker offers a powerful, privacy-first sanctuary. The Local SQL Agent allows you to upload CSV files directly to your device. Your data never leaves your computer, ensuring complete confidentiality. The on-device engine then prepares and analyzes it, letting you ask specific questions about your sales, trends, or performance to extract key insights without the hassle of spreadsheets.
Publish & Embed
Once your insight is visualized, the story is ready to be shared with the world. StatPecker enables you to seamlessly integrate these interactive visuals into your digital ecosystem. Embed them directly into blog posts, articles, websites, or internal wikis, creating a dynamic and engaging experience for your readers and team members without any coding.
Download & Use Anywhere
Not every story is told online. For reports, presentations, or print materials, StatPecker provides the flexibility to export your creations. Download your infographics as high-quality image files, ready to be dropped into slide decks, PDF reports, or social media, ensuring your compelling data narrative can travel anywhere your work takes you.
Use Cases of StatPecker
Content Creators & Journalists
Writers and journalists use StatPecker to rapidly enrich their articles and blog posts with authoritative, data-driven visuals. Instead of describing a trend, they can embed an interactive chart that proves it, transforming their content from informative to irrefutable and significantly boosting reader engagement and trust.
Marketing & Sales Teams
Marketing professionals leverage StatPecker to turn performance metrics and campaign data into stunning, easy-to-understand reports for stakeholders and clients. Sales teams can visualize regional performance or product trends to craft compelling narratives that support their strategies and presentations, making data a persuasive ally.
Educators & Trainers
Educators find a powerful ally in StatPecker for simplifying complex subjects. By converting statistical information, historical data, or scientific results into clear infographics, they can create more accessible and memorable learning materials that help students grasp difficult concepts through visual storytelling.
Business Analysts & Consultants
Analysts and consultants use the Local SQL Agent to privately explore client or internal data sets. They can quickly identify key drivers, summarize revenue by region, or spot anomalies, then instantly generate professional visuals to include in their deliverables, speeding up analysis and enhancing their reporting clarity.
Frequently Asked Questions
How does the Local SQL Agent ensure my data is private?
The Local SQL Agent is designed with privacy as its default state. When you upload a CSV file, the entire processing pipeline—from data preparation to analysis—runs locally on your own device. Your data never touches StatPecker's servers, ensuring it remains completely confidential and secure throughout your exploration.
What are the limits of the Free Tier?
The Free Tier is a generous starting point, offering unlimited projects and embeds (with manual edits). It includes 25 AI queries to ask questions from public sources and allows for 10 CSV uploads to the Local SQL Agent, providing ample opportunity to test the platform's core capabilities for data storytelling.
What does "Lifetime Access" include?
The Lifetime Access plan is a one-time payment that grants permanent access to all current and future features of StatPecker. This includes unlimited AI queries, unlimited CSV uploads, unlimited projects and embeds, and priority consideration for feature requests. It's designed for power users who want a permanent, cost-effective solution.
Can I edit the visuals after they are generated?
Yes, you maintain creative control. While AI generates the initial visual based on your query or data, StatPecker provides options for manual edits on the embeds. This allows you to adjust colors, and labels, or refine the design to perfectly match your brand or presentation style before publishing or downloading.
Explore more in this category:
Similar to StatPecker
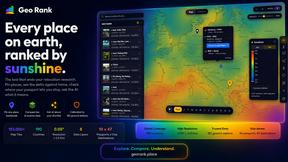
GeoRank
Planning a relocation or long-term stay abroad? Compare places on sunshine, cost, tax, visa access for your passport, then ask AI about your short
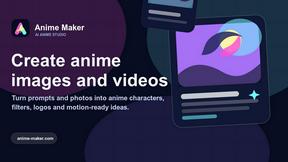
Anime Maker
Create anime images, characters, logos, filters, and image-to-video concepts with AI.

ComicsMaker
AI comic maker for turning prompts into comic strips, manga panels, storyboards, and export-ready visual drafts.


Easymotion - AI Motion Graphic Generator
AI motion graphics and map animation generator for content creators, editors, founders and marketers.

Wisprs
Wisprs turns your audio and video into accurate transcripts with speaker labels, AI summaries, and support for over 100 languages.