LoadTester
LoadTester lets you run and monitor load tests from your browser to catch performance issues before they reach production.
Visit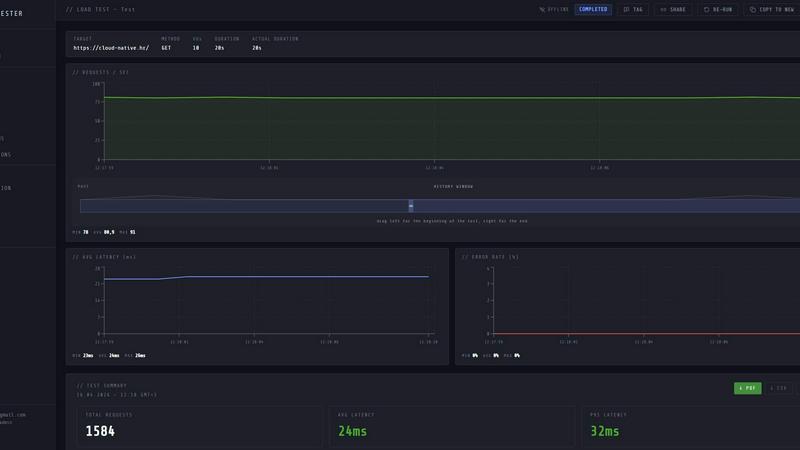
About LoadTester
LoadTester is a modern HTTP and API load testing tool built by Cloud Native d.o.o. for engineering teams that need repeatable performance checks without the overhead of managing infrastructure. It allows developers, QA engineers, and platform teams to run distributed load tests directly from their browser or CI/CD pipeline, providing live analytics, p95 and error-rate thresholds, scheduled baselines, and run-to-run comparisons. The core value proposition is simplicity: you create a test, choose virtual users or requests per second, monitor live latency and error rates, review completed results, compare runs, and catch performance regressions before users notice. It eliminates the need to provision, configure, or orchestrate any load testing infrastructure, with cold starts under three seconds and the ability to scale up to ten thousand virtual users or ten thousand requests per second. LoadTester includes exports in PDF, CSV, and JSON formats, scheduled tests, API access, and workflow integrations for teams that want simple, repeatable performance checks. It is built for scale, performance, and reliability, with a free plan available so teams can start testing immediately. The tool supports both VU (virtual user) and RPS (requests per second) modes, live streaming charts, auto-stop thresholds, and Slack or email alerts for regressions. Whether you are validating a new endpoint, running a spike test on a checkout flow, or establishing a nightly release gate, LoadTester provides the guardrails and visibility your team needs to ship with confidence.
Features of LoadTester
Instant Execution, Distributed by Default
Start distributed load tests in seconds without any infrastructure setup, worker orchestration, or scheduling headaches. Your team focuses on results while LoadTester handles worker scaling, infrastructure coordination, and execution flow. With a cold start of under three seconds and auto-scaling workers, you can go from idea to live test in moments. The queue time is effectively zero milliseconds, meaning no waiting for resources to become available. This feature eliminates the traditional pain of provisioning servers, configuring load generators, and managing test infrastructure, allowing developers to run performance tests as easily as they run unit tests.
Live Analytics and Real-Time Monitoring
Watch requests, latency, failures, throughput, and bottlenecks in real time while your test is running. The live dashboard updates continuously with key metrics including requests per second, p50, p95, and p99 latency, error counts, and active virtual users. A latency distribution chart shows the last sixty seconds of data across p50, p95, and p99 percentiles, giving you immediate visibility into performance trends. Unlike traditional tools that show results minutes after the test completes, LoadTester streams data live so you can spot issues as they happen and make informed decisions about stopping or adjusting tests on the fly.
Smart Auto-Stop with Thresholds
Set failure or latency thresholds and automatically stop tests when things go sideways, preventing wasted time and resources. You can configure auto-stop rules based on p95 latency exceeding a specific value, error rate surpassing a percentage, or regression compared to a baseline run. When a threshold is breached, LoadTester can automatically stop the test and trigger notifications via Slack or email. This guardrail system ensures that problematic tests do not run indefinitely, and your team is immediately alerted when performance degrades. You can also set up webhooks on completion to post result links to release bots or other workflow tools.
CI/CD Ready Integrations and Automation
Run tests on every deploy, every commit, or on a schedule without manual intervention. LoadTester provides API access and webhook support that integrates seamlessly with your existing CI/CD pipeline. You can trigger tests from GitHub Actions, GitLab CI, Jenkins, or any other automation platform. Scheduled tests allow you to establish nightly release gates or hourly baseline checks that run automatically. When tests complete, results are exported in PDF, CSV, or JSON format, and notifications are sent to Slack or email based on threshold breaches or regressions. This automation ensures performance testing becomes a natural part of your development workflow rather than a manual afterthought.
Use Cases of LoadTester
Spike Testing for E-Commerce Checkout Flows
E-commerce platforms need to validate that their checkout endpoints can handle sudden traffic spikes during flash sales, product launches, or holiday shopping events. With LoadTester, you can create a spike test targeting the checkout API endpoint, setting it to five hundred requests per second for three hundred seconds. While the test runs, you monitor live throughput, p95 latency, and error rates on the streaming dashboard. If p95 latency exceeds four hundred milliseconds or the error rate goes above two percent, the auto-stop feature halts the test and alerts the team via Slack. After completion, you compare results against a baseline run to catch regressions before real users experience slowdowns.
Nightly Release Gates for Continuous Deployment
Engineering teams practicing continuous deployment need automated performance checks that run every night to catch regressions before they reach production. LoadTester allows you to schedule a nightly test that runs at 02:00 UTC, targeting critical API endpoints like authentication, search, and data retrieval. The test uses predefined thresholds for p95 latency and error rate, and if any threshold is breached, the system automatically stops the test and sends a notification to Slack and email. The team reviews the completed results the next morning, compares them to previous runs, and decides whether to proceed with the release or roll back changes. This use case ensures performance regressions are caught early without manual intervention.
Baseline Comparison for API Refactoring
When your team refactors an API endpoint or migrates to a new backend service, you need to prove that performance has not degraded. LoadTester lets you run a baseline test on the existing endpoint, recording metrics like average latency, p95, p99, and throughput. After deploying the refactored code, you run the same test configuration and compare results side by side. The regression detection feature automatically flags any latency increase of fifteen percent or more, notifying the team via Slack and email. This use case gives developers confidence that their changes maintain or improve performance, preventing accidental slowdowns from reaching production.
Capacity Planning for New Feature Launches
Before launching a new feature that will attract significant user traffic, engineering teams need to understand the capacity limits of their infrastructure. LoadTester enables you to run ramp-up tests that gradually increase virtual users from zero to ten thousand while monitoring how latency and error rates respond. You can observe the exact point where p95 latency starts to spike or errors begin to appear, giving you data-driven insights into your system's breaking point. The completed results include total requests, average latency, p95, and data sent and received, which you can export as PDF or CSV for capacity planning reports shared with stakeholders.
Frequently Asked Questions
How does LoadTester handle infrastructure for running load tests?
LoadTester completely eliminates the need for you to provision, configure, or manage any load testing infrastructure. When you create and launch a test, the system automatically dispatches distributed workers that scale based on your test requirements. The cold start from test creation to first request takes under three seconds, and workers auto-scale to handle the load you specify. There is zero infrastructure to provision, no servers to configure, and no orchestration to manage. Your team simply focuses on defining the test scenario and analyzing the results.
What types of tests can I run with LoadTester?
LoadTester supports HTTP and API load testing for GET, POST, PUT, and DELETE methods. You can run tests in two modes: Virtual Users (VUs) mode, which simulates a specific number of concurrent users, or Requests Per Second (RPS) mode, which maintains a constant throughput rate. You can configure test duration, set target URLs, and define thresholds for p95 latency and error rate. The tool supports spike tests, baseline tests, ramp-up tests, and scheduled nightly tests. Results include live streaming analytics, latency distribution charts, and exportable summaries in PDF, CSV, and JSON formats.
Can LoadTester integrate with my CI/CD pipeline?
Yes, LoadTester provides API access and webhook support that integrates seamlessly with CI/CD pipelines. You can trigger tests from GitHub Actions, GitLab CI, Jenkins, or any other automation platform using the LoadTester API. The system supports scheduled tests that run automatically at specified times, such as nightly release gates. Test completion triggers webhooks that can post result links to release bots, and threshold breaches trigger notifications via Slack and email. This integration ensures performance testing becomes an automated part of your deployment workflow rather than a manual process.
What happens when a test exceeds defined thresholds?
LoadTester includes a smart auto-stop feature that monitors defined thresholds in real time. You can configure thresholds for p95 latency, error rate, and regression compared to a baseline run. When a threshold is breached, the system automatically stops the test to prevent wasted resources and immediately sends notifications via Slack and email to the configured channels. The completed test results are still saved and available for review, so your team can analyze what caused the breach. This guardrail system ensures problematic tests do not run indefinitely and that your team is alerted instantly when performance degrades.
Pricing of LoadTester
LoadTester offers a free plan that allows teams to start testing immediately without any upfront investment. The free plan includes access to core features such as instant execution, live analytics, and basic threshold configuration. For teams that need higher scale, advanced automation, and priority support, paid plans are available with increased limits on virtual users, requests per second, scheduled tests, and API access. Specific pricing details for paid tiers can be found on the LoadTester pricing page, and the free plan is available to start your first test today.
Similar to LoadTester
JustLaunched
The launch platform for indie makers — schedule your launch, get in front of buyers, and blast across directories.

Headless Domains
Headless Domains empowers AI agents with secure, verifiable identities, enabling trust and seamless interactions across digital platforms.
ProcessSpy
ProcessSpy empowers you to masterfully monitor and analyze macOS processes with advanced features and seamless integration for a pro-level experience.
Claw Messenger
Give your AI agent its own iMessage number to join your conversations naturally and instantly.
Datamata Studios
Datamata Studios empowers developers with free tools and market insights to navigate skill trends and elevate their careers through data-driven.