Fusedash vs StatPecker
Side-by-side comparison to help you choose the right product.
Fusedash transforms raw data into intuitive dashboards and charts, empowering your team to act on insights instantly.
Last updated: March 4, 2026

StatPecker
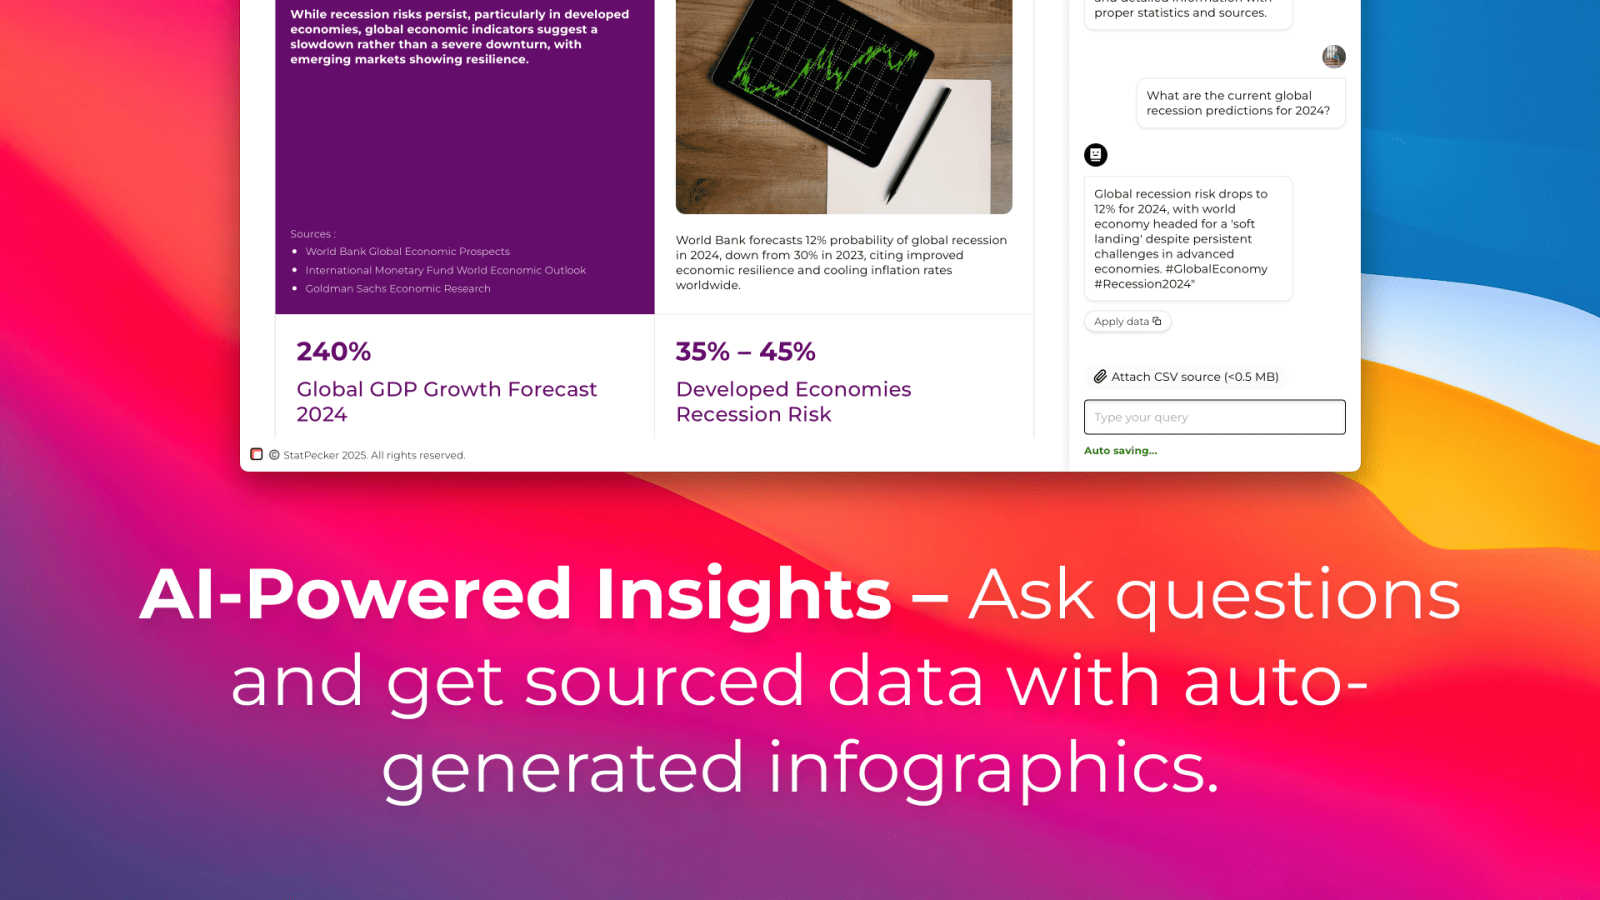
StatPecker transforms your private data into stunning, shareable visual stories.
Last updated: March 1, 2026
Visual Comparison
Fusedash

StatPecker
Feature Comparison
Fusedash
Flexible Views
Fusedash allows users to create tailored dashboard views that cater to the specific needs of different teams. With the ability to transform the same dataset into various formats—dashboards, charts, maps, or report-style views—it ensures stakeholders see only the most relevant information. This flexibility reduces the need for back-and-forth communication and empowers teams to focus on the insights that matter most.
AI Chart Generator
The AI Chart Generator feature enables users to swiftly create high-quality visuals from their data. Whether starting from a CSV or an API, users can generate charts in minutes, apply comparisons, and refine labels to ensure the visuals effectively communicate the intended story. This feature allows charts to be used as standalone visuals or integrated into larger dashboards, enhancing reporting efficiency.
Dashboard Software
Fusedash combines powerful dashboarding capabilities with narrative reporting, allowing teams to not only monitor KPIs but also understand the context behind performance changes. By integrating storytelling elements into dashboards, users can communicate what has changed, why it matters, and what the next steps should be, promoting alignment and reducing discrepancies in reporting.
AI Chat
Fusedash features an AI-powered chat interface that allows users to ask questions about their data in plain language. This smart chat functionality helps users explore breakdowns, get suggestions for relevant metrics and charts, and quickly generate insights that can be transformed into shareable dashboard views. This feature empowers users to engage with their data intuitively and efficiently.
StatPecker
Ask Your Query
Begin your data journey with a simple question. StatPecker's AI acts as your personal research assistant, pulling insights from validated sources to generate answers. There's no need to navigate complex analytics software; just ask in plain language and receive credible, data-backed responses almost instantly, ready to be visualized.
Upload & Analyze CSVs (Local SQL Agent)
For your private data, StatPecker offers a powerful, privacy-first sanctuary. The Local SQL Agent allows you to upload CSV files directly to your device. Your data never leaves your computer, ensuring complete confidentiality. The on-device engine then prepares and analyzes it, letting you ask specific questions about your sales, trends, or performance to extract key insights without the hassle of spreadsheets.
Publish & Embed
Once your insight is visualized, the story is ready to be shared with the world. StatPecker enables you to seamlessly integrate these interactive visuals into your digital ecosystem. Embed them directly into blog posts, articles, websites, or internal wikis, creating a dynamic and engaging experience for your readers and team members without any coding.
Download & Use Anywhere
Not every story is told online. For reports, presentations, or print materials, StatPecker provides the flexibility to export your creations. Download your infographics as high-quality image files, ready to be dropped into slide decks, PDF reports, or social media, ensuring your compelling data narrative can travel anywhere your work takes you.
Use Cases
Fusedash
Marketing Analytics
Marketing teams can leverage Fusedash to visualize campaign performance across various channels. By creating tailored dashboards, they can track key metrics such as engagement rates, conversion rates, and ROI, ensuring that stakeholders have a clear view of what strategies are working and what needs adjustment.
Sales Performance Monitoring
Sales teams can utilize Fusedash to monitor their performance in real-time. By integrating data from multiple sources, they can create dashboards that showcase sales trends, pipeline health, and regional performance, allowing for informed decision-making and timely interventions.
Operational Insights
Operations teams can benefit from Fusedash by visualizing operational metrics such as inventory levels, supply chain performance, and production efficiency. Custom dashboards provide insights that help identify bottlenecks and optimize processes, driving overall operational excellence.
Financial Reporting
Finance departments can streamline their reporting processes with Fusedash. By connecting various financial datasets, they can build comprehensive dashboards that display key financial metrics, trends, and forecasts, fostering transparency and enabling strategic financial planning.
StatPecker
Content Creators & Journalists
Writers and journalists use StatPecker to rapidly enrich their articles and blog posts with authoritative, data-driven visuals. Instead of describing a trend, they can embed an interactive chart that proves it, transforming their content from informative to irrefutable and significantly boosting reader engagement and trust.
Marketing & Sales Teams
Marketing professionals leverage StatPecker to turn performance metrics and campaign data into stunning, easy-to-understand reports for stakeholders and clients. Sales teams can visualize regional performance or product trends to craft compelling narratives that support their strategies and presentations, making data a persuasive ally.
Educators & Trainers
Educators find a powerful ally in StatPecker for simplifying complex subjects. By converting statistical information, historical data, or scientific results into clear infographics, they can create more accessible and memorable learning materials that help students grasp difficult concepts through visual storytelling.
Business Analysts & Consultants
Analysts and consultants use the Local SQL Agent to privately explore client or internal data sets. They can quickly identify key drivers, summarize revenue by region, or spot anomalies, then instantly generate professional visuals to include in their deliverables, speeding up analysis and enhancing their reporting clarity.
Overview
About Fusedash
Fusedash is an innovative AI-powered data visualization platform that empowers teams to convert their connected data into meaningful, actionable insights. Designed for organizations tired of navigating through disjointed reporting tools, Fusedash serves as a cohesive workspace where users can create decision-ready dashboards, interactive charts, detailed maps, and narrative reports efficiently. Its core value proposition revolves around consistency and efficiency: teams define key metrics and KPIs once and reuse them across all visualizations and reports. This ensures that everyone—from executives to marketing and operations—is aligned with the same trusted data. Fusedash is perfect for teams seeking to streamline their reporting processes, eliminate conflicting data narratives, and foster a data-driven culture. By leveraging integrated AI features such as natural language data chat and smart visualization assistance, Fusedash enhances data exploration and makes reporting not only faster but also more accessible. Ultimately, it transforms raw data into a shared source of truth, driving alignment and informed decision-making across the organization.
About StatPecker
Imagine staring at a spreadsheet, a sea of numbers that holds a powerful story, but lacking the time or design skills to set it free. This is the journey StatPecker begins with. It is an AI-powered companion built for the modern storyteller, transforming raw, often intimidating data into visually captivating infographics in mere seconds. Born from the founders' own experiences in tech and product development, StatPecker is designed to democratize data visualization, making it accessible to anyone with a story to tell. It serves a diverse cast of characters: the content creator racing a deadline, the marketer crafting a compelling report, the educator simplifying complex topics, and the analyst seeking to communicate trends with clarity. Its core mission is to automate the tedious process of data storytelling, eliminating the need for manual design work or expensive services. By doing so, StatPecker empowers its users to focus on what truly matters—extracting the narrative, uncovering the insights, and amplifying their message with credibility and visual impact. It's more than a tool; it's a bridge between raw information and human understanding.
Frequently Asked Questions
Fusedash FAQ
What types of data can I integrate with Fusedash?
Fusedash allows users to integrate data from various sources, including CSV uploads, API connections, and public datasets. This flexibility enables teams to create comprehensive views that combine multiple data streams for deeper insights.
How does Fusedash ensure data consistency across reports?
Fusedash allows users to define key metrics and KPIs once, which can then be reused across all dashboards and reports. This standardization ensures that all teams are working with the same definitions and numbers, promoting trust in the data.
Can I share my dashboards with stakeholders?
Yes, Fusedash provides options to share dashboards with stakeholders, ensuring that everyone has access to the same insights. This feature fosters alignment within teams and enhances collaborative decision-making.
How does the AI Chat feature work?
The AI Chat feature allows users to ask questions about their data in natural language. It provides suggestions for metrics, charts, and breakdowns, helping users navigate their data more effectively and quickly generate insights for reporting.
StatPecker FAQ
How does the Local SQL Agent ensure my data is private?
The Local SQL Agent is designed with privacy as its default state. When you upload a CSV file, the entire processing pipeline—from data preparation to analysis—runs locally on your own device. Your data never touches StatPecker's servers, ensuring it remains completely confidential and secure throughout your exploration.
What are the limits of the Free Tier?
The Free Tier is a generous starting point, offering unlimited projects and embeds (with manual edits). It includes 25 AI queries to ask questions from public sources and allows for 10 CSV uploads to the Local SQL Agent, providing ample opportunity to test the platform's core capabilities for data storytelling.
What does "Lifetime Access" include?
The Lifetime Access plan is a one-time payment that grants permanent access to all current and future features of StatPecker. This includes unlimited AI queries, unlimited CSV uploads, unlimited projects and embeds, and priority consideration for feature requests. It's designed for power users who want a permanent, cost-effective solution.
Can I edit the visuals after they are generated?
Yes, you maintain creative control. While AI generates the initial visual based on your query or data, StatPecker provides options for manual edits on the embeds. This allows you to adjust colors, and labels, or refine the design to perfectly match your brand or presentation style before publishing or downloading.
Alternatives
Fusedash Alternatives
Fusedash is an AI-powered data visualization platform that simplifies the process of turning raw data into actionable insights through clear dashboards and interactive charts. As part of the Analytics & Data category, it is designed for teams seeking a unified workspace to streamline their reporting and decision-making processes. However, users often find themselves exploring alternatives due to various factors such as pricing concerns, specific feature requirements, or compatibility with existing platforms. When considering alternatives, it's essential to evaluate the ease of use, integration capabilities, and the ability to deliver consistent and accurate data that aligns with your organization's goals.
StatPecker Alternatives
In the bustling world of data visualization, tools like StatPecker emerge as powerful allies, transforming raw numbers into compelling visual stories. This AI-powered platform is designed for anyone who needs to communicate insights quickly, from marketers to educators, by automating the creation of infographics and reports. Yet, the quest for the perfect tool is a personal journey, and users often explore alternatives for various reasons, such as budget constraints, the need for specific integrations, or a desire for different feature sets. When embarking on this search, it's wise to consider what truly matters for your workflow. Key factors include the ease of transforming your data, the security of your sensitive information, and the flexibility to share your visuals across different platforms. The ideal tool should feel like a natural extension of your process, removing friction and empowering you to tell your data's story with clarity and impact.