Fusedash
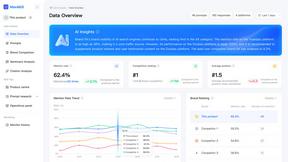
Fusedash transforms raw data into intuitive dashboards and charts, empowering your team to act on insights instantly.
Visit
About Fusedash
Fusedash is an innovative AI-powered data visualization platform that empowers teams to convert their connected data into meaningful, actionable insights. Designed for organizations tired of navigating through disjointed reporting tools, Fusedash serves as a cohesive workspace where users can create decision-ready dashboards, interactive charts, detailed maps, and narrative reports efficiently. Its core value proposition revolves around consistency and efficiency: teams define key metrics and KPIs once and reuse them across all visualizations and reports. This ensures that everyone—from executives to marketing and operations—is aligned with the same trusted data. Fusedash is perfect for teams seeking to streamline their reporting processes, eliminate conflicting data narratives, and foster a data-driven culture. By leveraging integrated AI features such as natural language data chat and smart visualization assistance, Fusedash enhances data exploration and makes reporting not only faster but also more accessible. Ultimately, it transforms raw data into a shared source of truth, driving alignment and informed decision-making across the organization.
Features of Fusedash
Flexible Views
Fusedash allows users to create tailored dashboard views that cater to the specific needs of different teams. With the ability to transform the same dataset into various formats—dashboards, charts, maps, or report-style views—it ensures stakeholders see only the most relevant information. This flexibility reduces the need for back-and-forth communication and empowers teams to focus on the insights that matter most.
AI Chart Generator
The AI Chart Generator feature enables users to swiftly create high-quality visuals from their data. Whether starting from a CSV or an API, users can generate charts in minutes, apply comparisons, and refine labels to ensure the visuals effectively communicate the intended story. This feature allows charts to be used as standalone visuals or integrated into larger dashboards, enhancing reporting efficiency.
Dashboard Software
Fusedash combines powerful dashboarding capabilities with narrative reporting, allowing teams to not only monitor KPIs but also understand the context behind performance changes. By integrating storytelling elements into dashboards, users can communicate what has changed, why it matters, and what the next steps should be, promoting alignment and reducing discrepancies in reporting.
AI Chat
Fusedash features an AI-powered chat interface that allows users to ask questions about their data in plain language. This smart chat functionality helps users explore breakdowns, get suggestions for relevant metrics and charts, and quickly generate insights that can be transformed into shareable dashboard views. This feature empowers users to engage with their data intuitively and efficiently.
Use Cases of Fusedash
Marketing Analytics
Marketing teams can leverage Fusedash to visualize campaign performance across various channels. By creating tailored dashboards, they can track key metrics such as engagement rates, conversion rates, and ROI, ensuring that stakeholders have a clear view of what strategies are working and what needs adjustment.
Sales Performance Monitoring
Sales teams can utilize Fusedash to monitor their performance in real-time. By integrating data from multiple sources, they can create dashboards that showcase sales trends, pipeline health, and regional performance, allowing for informed decision-making and timely interventions.
Operational Insights
Operations teams can benefit from Fusedash by visualizing operational metrics such as inventory levels, supply chain performance, and production efficiency. Custom dashboards provide insights that help identify bottlenecks and optimize processes, driving overall operational excellence.
Financial Reporting
Finance departments can streamline their reporting processes with Fusedash. By connecting various financial datasets, they can build comprehensive dashboards that display key financial metrics, trends, and forecasts, fostering transparency and enabling strategic financial planning.
Frequently Asked Questions
What types of data can I integrate with Fusedash?
Fusedash allows users to integrate data from various sources, including CSV uploads, API connections, and public datasets. This flexibility enables teams to create comprehensive views that combine multiple data streams for deeper insights.
How does Fusedash ensure data consistency across reports?
Fusedash allows users to define key metrics and KPIs once, which can then be reused across all dashboards and reports. This standardization ensures that all teams are working with the same definitions and numbers, promoting trust in the data.
Can I share my dashboards with stakeholders?
Yes, Fusedash provides options to share dashboards with stakeholders, ensuring that everyone has access to the same insights. This feature fosters alignment within teams and enhances collaborative decision-making.
How does the AI Chat feature work?
The AI Chat feature allows users to ask questions about their data in natural language. It provides suggestions for metrics, charts, and breakdowns, helping users navigate their data more effectively and quickly generate insights for reporting.
Explore more in this category:
Similar to Fusedash
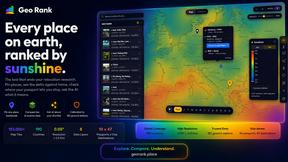
GeoRank
Planning a relocation or long-term stay abroad? Compare places on sunshine, cost, tax, visa access for your passport, then ask AI about your short
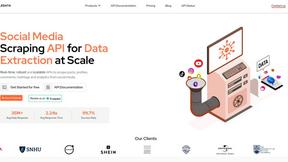
EnsembleData
With EnsembleData, you can unlock the story behind any social trend by scraping real-time posts, profiles, and analytics at scale.
Decker
Decker transforms your consulting deliverables into polished outputs while providing workflows, expert support, and monetization opportunities.
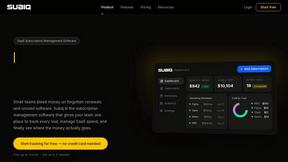
Subiq
Subiq simplifies SaaS subscription management for small teams, helping you track expenses and eliminate wasted spend on unused tools.
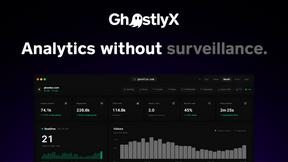
GhostlyX Privacy-First Web Analytics
GhostlyX gives you the clear insights you need while keeping every visitor's privacy fully intact, no cookies required.
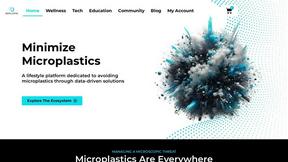
Microplastic Intake App
Start your journey to wellness by tracking and reducing microplastics in your daily life with research-backed insights.
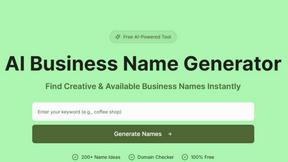
AI Business Name Generator
Unlock your brand's potential with our AI Business Name Generator, crafting unique and memorable names for your startup in an instant.