SeasonalVantage
SeasonalVantage reveals which stocks to trade each week by combining high-probability seasonal data with real-time options flow for a decisive edge.
Visit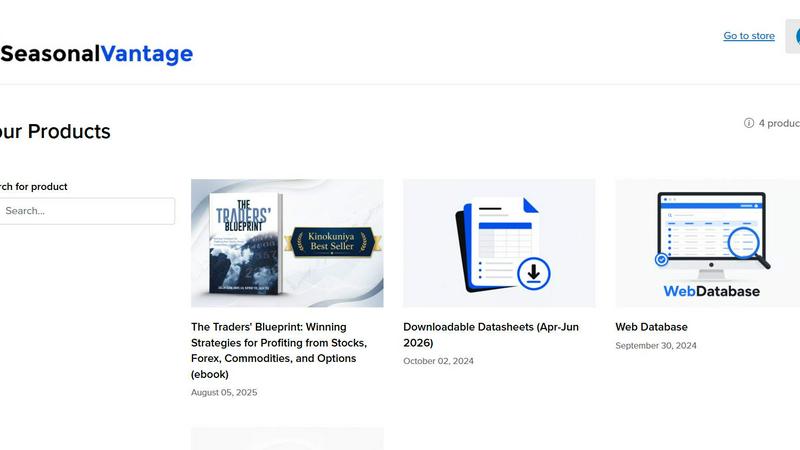
About SeasonalVantage
SeasonalVantage is not just another data platform. It is a trading research and market seasonality system built for traders and active investors who refuse to rely on guesswork. The core idea is simple but powerful: certain stocks and ETFs have historically performed better during specific times of the year, and knowing those windows can give you a real edge. This platform helps you identify those opportunities using decades of historical seasonal data, so you are not chasing random tickers or reacting to noise. Instead, you start your week with a curated, data-driven shortlist of names that have a statistical reason to be on your radar.
The product is designed for anyone who wants a more structured and repeatable trading routine. Whether you are a part-time trader juggling a day job or a full-time active investor, SeasonalVantage saves you hours of manual research. It combines a web-based seasonality database with downloadable datasheets, allowing you to screen for bullish and bearish patterns based on win rate, date range, years tested, calendar-day performance, sector, and industry. Members also receive curated watchlists, weekly market updates, educational videos, and access to the SVI Alpha Telegram Bot. This bot surfaces potential opportunities by combining seasonal data with technical conditions, helping you focus on setups that are actually "in play" right now.
The platform goes further by adding curated options flow analysis. This helps you see where large institutional money may be moving, giving you a confirmation layer for your seasonal ideas. The goal is not to drown you in more tools. The goal is to bring clarity, focus, and saved time to your trading process. SeasonalVantage is intended for educational and research purposes only. Past performance does not guarantee future results, but the data can help you make more informed decisions.
Features of SeasonalVantage
Seasonality Database
The heart of the platform is a powerful, web-based seasonality database that lets you instantly identify high-probability historical patterns. You can search across thousands of stocks and ETFs, filtering by win rate as high as 90% or more, specific date ranges, number of years tested, and calendar-day performance. The database also breaks down results by sector and industry, so you can understand the broader context behind a seasonal move. Every pattern is backed by historical data, not hype. You can access everything directly in your browser or download detailed datasheets for offline analysis. This feature alone replaces hours of manual chart scrolling and spreadsheet building every week.
SVI Alpha Telegram Bot Screener
The SVI Alpha Bot is a real-time screener that lives inside Telegram, making it incredibly convenient to use on any device. Instead of manually digging through the database every day, the bot does the heavy lifting for you. It screens the entire seasonal database and surfaces stocks or ETFs that are currently entering a historically favorable seasonal window. It also checks for technical conditions that align with the seasonal setup. The result is a focused, actionable shortlist sent directly to your phone. You get to know exactly which "in-play" stocks to watch right now, without the noise of the broader market.
Curated Options Flow
This feature helps you see where the "smart money" might be positioning themselves. SeasonalVantage simplifies complex options activity into a cleaner, more readable format. You get insights into bullish and bearish premium, net delta, expiry focus, and key option clusters. This is not a standalone signal. Instead, it is designed as a confirmation layer to use alongside your seasonal analysis. When a stock has a strong historical seasonal pattern and you also see unusual options activity pointing in the same direction, your conviction can be much higher. Weekly asset class insights and exclusive alerts on unusual institutional stock flow are also included.
Weekly Market Updates and Educational Videos
Trading is not just about data; it is about understanding the story behind the numbers. SeasonalVantage provides weekly market updates that give you the broader context for the week ahead. These updates cover key themes, sector performance, and macroeconomic factors that might impact your watchlist. Additionally, members get access to educational videos that explain how to use the platform effectively, how to interpret seasonal patterns, and how to build a disciplined trading routine. This feature ensures you are not just getting data, but also the knowledge to use it wisely.
Use Cases of SeasonalVantage
Building a Weekly Watchlist in Minutes
Every Sunday, instead of spending hours scanning charts and news, you can open the Seasonality Database and filter for the upcoming week. Set your criteria for high win rate, a specific date range starting Monday, and your preferred sectors. Within seconds, you have a shortlist of stocks and ETFs that have historically performed well during that exact week. This becomes the foundation of your trading plan for the next five days. You save time and start your week with a clear, data-backed focus.
Confirming a Trade Idea with Options Flow
You find a stock that has a strong seasonal pattern with an 85% win rate over the last 10 years. But you want more confirmation before entering. You pull up the Curated Options Flow feature for that ticker. You see that large call buyers have been accumulating positions with a net delta skew to the upside, and the expiry aligns with the seasonal window. This additional layer of data gives you the confidence to take the trade, knowing that institutional money seems to agree with the historical pattern.
Scanning for In-Play Setups During the Week
You are busy with your day job but want to stay connected to the market. You rely on the SVI Alpha Telegram Bot. During your lunch break, you check your phone and see a notification: a specific tech ETF is entering a historically bullish window today, and the bot has flagged it as "in-play" based on technical conditions. You quickly review the chart, see the setup aligns, and place a trade. Without the bot, you would have missed this opportunity entirely.
Researching a New Sector or Theme
You have been hearing a lot about the renewable energy sector and want to explore potential trades. You use the Seasonality Database to filter by industry, selecting "Clean Energy." The database shows you which ETFs and stocks in that space have the strongest seasonal patterns in the upcoming months. You can see the average move, the best and worst performing periods, and the number of years tested. This research helps you build a focused watchlist for a sector you are new to, without getting overwhelmed by the hundreds of available tickers.
Frequently Asked Questions
What exactly is market seasonality and why does it work?
Market seasonality refers to the tendency of certain stocks or ETFs to perform better during specific calendar periods, like certain months or weeks. This can be driven by recurring events such as earnings seasons, tax deadlines, holiday spending, or sector-specific cycles. It is not a guarantee of future performance, but it provides a statistical edge based on historical data. SeasonalVantage quantifies this edge by showing you the win rate, average return, and number of years tested for each pattern, so you can make informed decisions.
How is the Seasonality Database different from a stock screener?
A standard stock screener filters stocks based on current fundamentals or technicals, like P/E ratio or moving averages. The SeasonalVantage database filters based on historical performance during specific time windows. For example, you can ask: "Which stocks have gone up 80% of the time during the first two weeks of November over the last 15 years?" A traditional screener cannot answer that question. This database is specifically designed to uncover recurring calendar-based opportunities that most traders overlook.
Do I need to be an experienced trader to use SeasonalVantage?
No. The platform is designed to be accessible for traders of all experience levels. If you are new to trading, you can start by using the weekly watchlists and the Telegram bot to get simple, actionable ideas. The educational videos and weekly updates will help you learn the concepts as you go. More experienced traders can dive deeper into the database, use advanced filters, and combine the data with their own technical analysis and options flow insights.
Is the options flow data a trading signal on its own?
No. The Curated Options Flow is explicitly designed as a confirmation layer, not a standalone signal. It is most powerful when used together with the seasonality data. A strong seasonal pattern combined with unusual options activity pointing in the same direction can significantly increase your confidence in a trade. However, you should always conduct your own research, manage your risk, and never rely on any single piece of data to make a trading decision.
Explore more in this category:
Similar to SeasonalVantage
Hishab
All-in-one POS, inventory, accounting and HR software for Bangladeshi SMEs — real-time sales, stock and finance in one place.



IZIPAY
IZIPAY is a virtual and physical crypto card service that lets users top up with digital assets and pay online like with a regular card.
PDFKing
Free online PDF tools to merge, compress, convert, edit, sign, and manage documents—no signup, watermarks, or daily limits.
Venduris
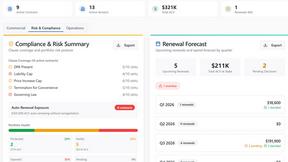
Venduris is a renewal intelligence platform that gives mid-size companies control over SaaS & AI contract renewals before leverage disappears.