Dividend Data vs Prediction Pulse
Side-by-side comparison to help you choose the right product.
Dividend Data
Effortlessly access 30 years of stock data, including dividends and financials, directly in your spreadsheets with Dividend Data.
Last updated: March 11, 2026
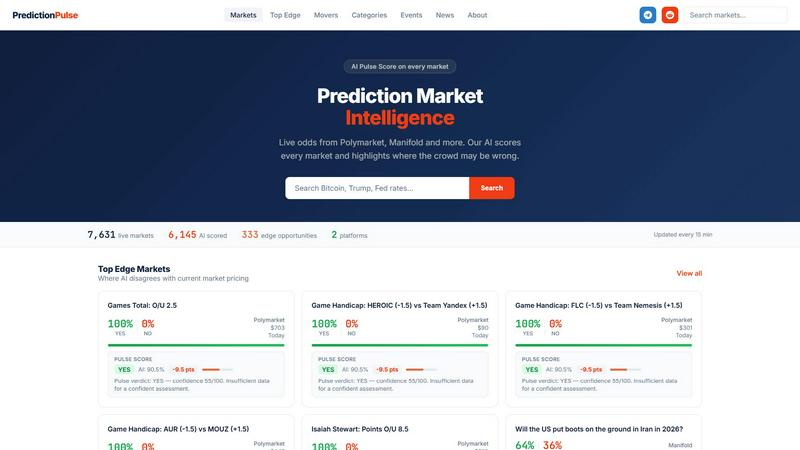
Prediction Pulse
Navigate prediction markets with AI insights that reveal where the crowd may be wrong.
Last updated: March 18, 2026
Visual Comparison
Dividend Data

Prediction Pulse
Feature Comparison
Dividend Data
Instant Data Access
With Dividend Data, users can access a vast array of financial information instantly. By simply typing a custom formula into their spreadsheet, they can retrieve real-time data on dividends, earnings, and prices, streamlining their investment research process and enhancing productivity.
Comprehensive Historical Data
Dividend Data provides more than 30 years of historical stock market data, allowing investors to analyze trends, evaluate performance over time, and make well-informed decisions based on extensive historical context. This depth of information is invaluable for strategic planning.
User-Friendly Custom Functions
Dividend Data boasts 16 custom functions specifically designed for dividend investors. These functions cover everything from dividend yields to payout ratios, enabling users to effortlessly extract the data they need without complex formulas or programming knowledge.
Cross-Platform Compatibility
Whether you're working in Google Sheets or Microsoft Excel, Dividend Data is fully compatible with both platforms. This flexibility ensures that investors can leverage its powerful capabilities regardless of their preferred spreadsheet tool, making it accessible for a wider audience.
Prediction Pulse
AI Pulse Score Engine
At the core of the platform is the proprietary Pulse Score, an AI-driven probability engine that independently analyzes every single prediction market. It goes beyond simply reflecting current odds by calculating its own estimate of an event's true likelihood. This score is presented alongside market prices, instantly highlighting discrepancies and potential mispricings where the AI's conviction diverges from the crowd's, offering a quantifiable edge for deeper investigation.
Cross-Platform Market Aggregation
Prediction Pulse acts as a unified command center, pulling in and continuously updating thousands of live markets from major platforms like Polymarket and Manifold. This aggregation saves users from the tedious task of checking multiple sites, providing a single, comprehensive view of global prediction market activity. All data is refreshed every 15 minutes, ensuring you have access to the most current trading signals and market movements in one place.
Canonical Event Grouping
Instead of presenting a chaotic list of individual bets, the platform's AI intelligently groups related markets into canonical real-world events. This transforms isolated predictions about political races, economic indicators, or tech milestones into cohesive event pages. This narrative structure allows users to understand the broader story, compare probabilities across different platforms for the same underlying event, and gain a holistic view of market sentiment on future outcomes.
AI-Generated Market News & Insights
To help users navigate major market movements, Prediction Pulse features an AI-generated news feed. This content automatically covers significant swings, volume surges, and interesting developments across the prediction market landscape. It doesn't just report the numbers; it provides context and explains the potential reasons behind the volatility, turning raw data into understandable intelligence for informed decision-making.
Use Cases
Dividend Data
Portfolio Management
Investors can use Dividend Data to manage their portfolios effectively by tracking dividends and performance metrics in real-time. This allows for quick adjustments and strategic rebalancing based on the latest data insights, enhancing overall investment efficiency.
Financial Analysis
Dividend Data is an essential resource for conducting financial analysis. With instant access to a wide range of financial metrics, investors can evaluate the health of their investments and identify potential opportunities or risks before making important decisions.
Investment Research
Dividend Data facilitates thorough investment research by providing historical data and current metrics in an easily digestible format. Investors can compare different stocks, assess their financials, and make informed decisions based on comprehensive data analysis.
Educational Purposes
Educators and financial advisors can utilize Dividend Data to teach students and clients about investment strategies and market behaviors. By demonstrating real-time data analysis and financial evaluation, they can enhance learning and understanding of the stock market.
Prediction Pulse
The Discerning Trader Seeking Alpha
For traders on platforms like Polymarket, Prediction Pulse is a vital scouting tool. By scanning the "Top Edge Movers" list, a trader can quickly identify markets where the AI's Pulse Score significantly disagrees with the current market price. This highlights potential mispricings—opportunities to buy "YES" or "NO" shares that the AI believes are undervalued. It provides a data-driven second opinion to validate or challenge their own theses before committing capital.
The Researcher Analyzing Collective Wisdom
Academics, journalists, and policy analysts use prediction markets as a sophisticated polling mechanism. Prediction Pulse aids this research by aggregating sentiment across platforms and organizing it around specific events. A researcher studying geopolitical risk can easily track the evolving probability of a ceasefire or regime change, using the AI's analysis and market volume data to gauge the strength and shifts in collective forecasting.
The Curious Observer Exploring the Future
For anyone fascinated by forecasting and future trends, Prediction Pulse offers a captivating window into the crowd's expectations on everything from politics to technology. The event pages and AI explanations tell a story about what people believe is coming next. It’s a tool for lifelong learners to explore probabilities on thousands of questions, satisfying curiosity about the future in a structured, data-rich format.
The Portfolio Manager Monitoring Risk Catalysts
Investment professionals can use the platform to monitor real-time sentiment on events that could impact financial markets. By following events related to elections, regulatory decisions, or macroeconomic indicators, a manager can see how prediction market odds shift in response to news. This provides an unfiltered, bet-backed perspective on the probability of potential market-moving events, complementing traditional analysis.
Overview
About Dividend Data
Dividend Data is a powerful tool designed to seamlessly integrate over 30 years of stock market data into your Google Sheets and Microsoft Excel spreadsheets. With coverage of more than 80,000 tickers, Dividend Data caters specifically to dividend and fundamental investors who seek quick and reliable access to crucial financial metrics. This innovative solution eliminates the need for API keys, coding, or manual data entry, allowing users to simply type a formula to receive live data. Investors can access vital information such as dividends, yields, payout ratios, growth rates, financial statements, earnings, ratios, and a plethora of other metrics. With a free tier offering 2,500 monthly credits and a suite of custom functions tailored to the needs of dividend investors, Dividend Data stands out as a resource built by investors, for investors. It empowers users to make informed decisions without the hefty costs typically associated with institutional-grade data.
About Prediction Pulse
Imagine standing at the crossroads of the future, where thousands of voices—traders, speculators, and everyday forecasters—are placing their bets on what comes next. The noise is deafening, the signals are scattered across different platforms, and finding a true edge feels like searching for a needle in a haystack. This is the journey Prediction Pulse was born to simplify. It is an AI-powered intelligence platform designed to be your guide through the vast and often chaotic world of prediction markets. By aggregating live markets from leading platforms like Polymarket and Manifold, Prediction Pulse does more than just collect data; it weaves disparate bets into coherent narratives around real-world events. At the heart of this journey is its proprietary Pulse Score—an AI probability engine that analyzes each market, estimates the most likely outcome, and highlights where the wisdom of the crowd may have gone astray. For the trader seeking an advantage, the researcher deciphering collective sentiment, or the curious observer peering into tomorrow, Prediction Pulse transforms fragmented predictions into a clear, actionable map of the future, helping you understand not just what is being predicted, but why.
Frequently Asked Questions
Dividend Data FAQ
How does Dividend Data work?
Dividend Data operates by allowing users to input specific formulas into their spreadsheets, which then return live financial data for chosen tickers. This eliminates the need for manual data entry and ensures accuracy.
Is there a cost associated with using Dividend Data?
Dividend Data offers a free tier with 2,500 monthly credits, allowing users to access essential data without any financial commitment. There are also paid options for those who need more extensive data usage.
Can I use Dividend Data on both Google Sheets and Excel?
Yes, Dividend Data is fully compatible with both Google Sheets and Microsoft Excel, providing flexibility for users to work with their preferred spreadsheet tool without losing functionality.
What types of data can I access with Dividend Data?
Users can access a wide array of data, including dividends, stock prices, financial ratios, growth rates, and comprehensive historical data for over 80,000 tickers, making it an invaluable resource for investors.
Prediction Pulse FAQ
What is a Pulse Score?
The Pulse Score is Prediction Pulse's proprietary AI-generated probability for a given market outcome. While the market price reflects the current collective bet of traders, the Pulse Score represents the platform's AI model's independent assessment of the true likelihood of that outcome. The difference between the market's "YES" percentage and the AI's score highlights where the model sees a potential edge or mispricing.
Which prediction market platforms does Prediction Pulse aggregate?
Currently, Prediction Pulse aggregates and displays live markets from two major platforms: Polymarket and Manifold. The platform tracks tens of thousands of markets from these sources, updating odds, volume, and its AI scores every 15 minutes to provide a consolidated, real-time view of the prediction market ecosystem.
How does the AI determine its Pulse Score and verdict?
The AI model analyzes a wide array of data related to each market's event, though the exact proprietary methodology is not disclosed. It synthesizes available information to estimate a probability. The "Pulse verdict" (e.g., YES or NO) is the AI's called outcome based on its score, accompanied by a confidence level (e.g., 55/100) that indicates the strength of its conviction in that assessment.
What are "Edge Opportunities"?
"Edge Opportunities" are specific markets where Prediction Pulse's AI identifies a significant divergence between its Pulse Score and the current market price. These are highlighted in sections like "Top Edge Movers" and represent instances where the AI believes the crowd may be mistaken. A large point difference (e.g., -11 pts) suggests a potential mispricing that users can investigate for trading or analytical purposes.
Alternatives
Dividend Data Alternatives
Dividend Data is a powerful tool designed for dividend and fundamental investors, offering over 30 years of stock market data for more than 80,000 tickers. By integrating seamlessly into Google Sheets and Microsoft Excel, it allows users to access a comprehensive suite of information, including dividends, yields, and growth rates, all through simple custom formulas. This innovative approach positions Dividend Data firmly within the Business and Finance category, catering to those who demand reliable financial insights. Many users find themselves searching for alternatives to Dividend Data due to various reasons such as pricing structures, specific features that may better suit their needs, or compatibility with other platforms they are using. When choosing an alternative, it's crucial to consider factors like data accuracy, the comprehensiveness of historical records, ease of use, and the availability of features tailored to specific investment strategies. These elements can significantly impact the effectiveness and enjoyment of your investment journey.
Prediction Pulse Alternatives
Prediction Pulse is an AI-powered intelligence platform in the business and finance category, designed to bring clarity to the world of prediction markets. It aggregates data from various platforms, groups them into real-world events, and uses a proprietary AI engine to analyze probabilities and trends. This helps users understand what the collective wisdom of markets is signaling about future outcomes. Users often explore alternatives for a variety of reasons. Some may seek different pricing models or a more specialized feature set tailored to a specific type of analysis. Others might prioritize a platform with a different user interface, deeper integration with certain trading tools, or a focus on markets outside the current aggregation scope. The needs of a casual observer differ greatly from those of a professional trader. When evaluating other platforms, consider the core value you seek. Look for the depth and reliability of market data aggregation, the sophistication of the analytical tools provided, and the clarity of insights generated. The ideal platform should not just present data but transform it into actionable intelligence that aligns with your goals, whether for research, trading, or simply satisfying curiosity.