ChartAI

About ChartAI
ChartAI is a powerful platform that empowers users to generate charts and diagrams effortlessly. Ideal for project managers, educators, and professionals, it leverages ChatGPT technology to simplify the creation of visual data representations. Experience enhanced productivity with intuitive tools that streamline your workflow.
ChartAI offers a free tier with 100 credits plus paid options for increased usage. Each subscription level provides added credits, advanced features, and potential discounts. Upgrading enhances your charting capabilities, facilitating better data visualization for diverse projects. Choose the plan that fits your needs best.
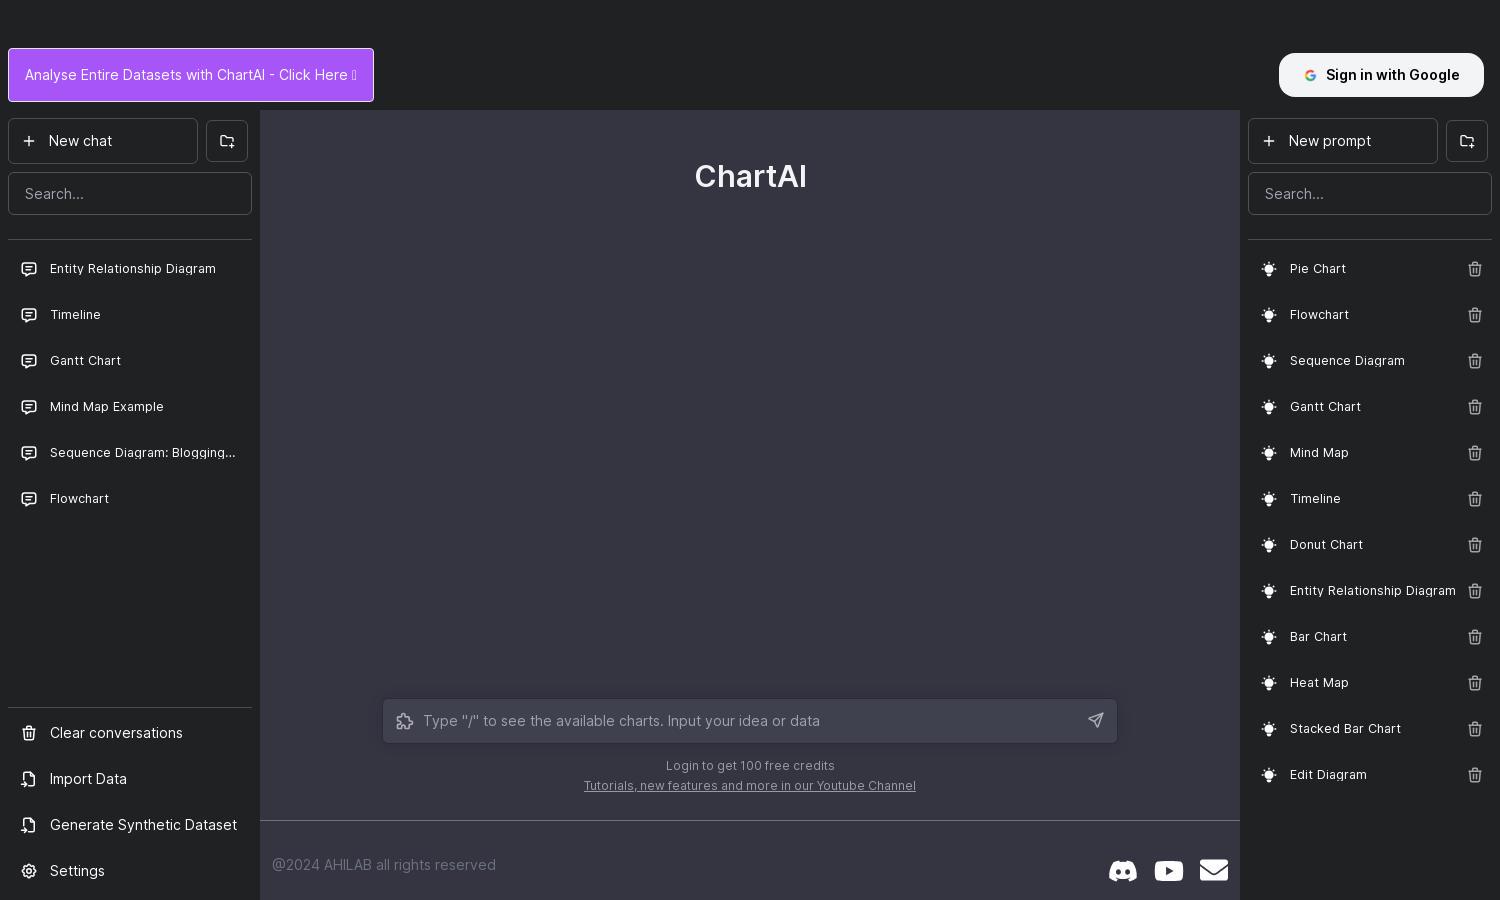
ChartAI's intuitive user interface ensures a seamless experience. Designed for ease of navigation, it features straightforward tools for creating various charts and diagrams. With user-friendly features and an attractive layout, ChartAI optimizes your workflow, making data visualization quick and efficient.
How ChartAI works
Users begin by signing into ChartAI, where they can initiate conversations with the AI for chart creation. The platform allows importing data and generating synthetic datasets to customize diagrams. Its user-friendly interface ensures effortless navigation through flows and exports, enhancing the data visualization journey efficiently.
Key Features for ChartAI
AI-Powered Chart Creation
ChartAI's AI-Powered Chart Creation feature allows users to create a variety of visualizations effortlessly. With ChatGPT technology, users can generate accurate flowcharts, Gantt charts, and more to visualize complex data quickly. This innovative approach streamlines project management and enhances productivity.
Synthetic Dataset Generation
The Synthetic Dataset Generation feature of ChartAI lets users easily import data or create synthetic datasets. This capability not only aids in effective visualization but also enhances project planning and analysis. By leveraging this tool, users can prepare customized charts that meet their specific requirements.
User-Friendly Interface
ChartAI boasts a User-Friendly Interface that enhances user experience during chart creation. Designed with intuitive navigation and clear tool access, it makes the process of generating diagrams straightforward. This feature ensures that users can efficiently create elaborate visuals without facing technical hurdles.
You may also like:


